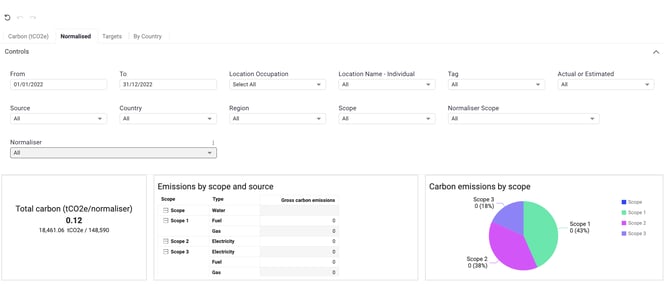
Rio allows you to create �normalisers� via the configuration area. A normaliser provides users with a means to make relative comparisons of their organisations performance based on its own key performance indicators (KPIs). Another common term used for normalisers are �intensity factors� (e.g. tCO2e/m2) To find out more please review the article on �What it a normaliser�.
If you have a list of normalisers covering a range of dates, it is possible to upload your normalisers in a spread sheet using the �Upload Normalisers� tool. From here you can download a template and subsequently upload your list of values.
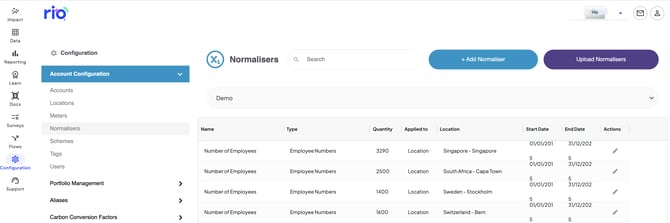
Once selected the following modal should appear :
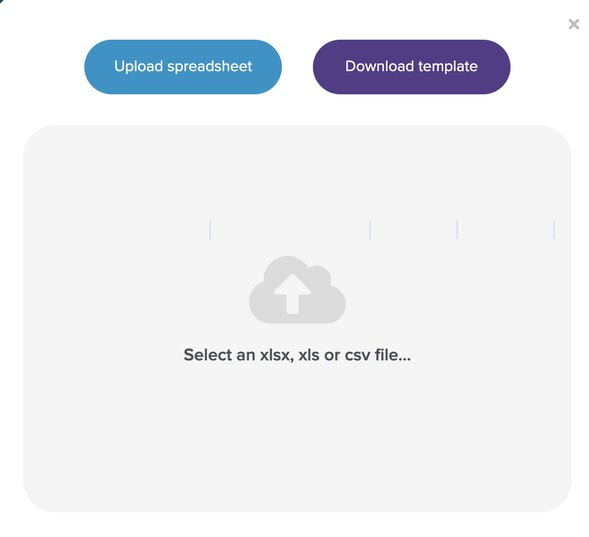
Select �Download template�. When opened, the sheet will contain the following fields:
- Normaliser name?- this will be the name of your normaliser. It can be any name (for example, London FTE, Hong Kong Floorspace, Annual revenue (�))
- Description � can include any further details on normaliser type.
- Quantity?- this is your actual normaliser value, used as divider (number of employees, number of machines, etc).
- Start Date,?End Date?- this is the normaliser date range interval. Your normaliser will be applied to transactions within this date range.
- Normaliser type?- Rio provides 3 predefined types (employee number, turnover, area), you can also pick any of 3 custom types specific to your organisations such as �widgets manufactured�, 'Number of beds', or �customers served�.
- Location � Rio will allow you to tie a specific Location (previously configured within Rio) to a normaliser
- Tag � Rio will allow you to tie a specific Tag (previously configured within Rio) to a normaliser.
- Scope � Rio provides 3 predefined levels of Scope; Account, Location, Tag. You will need to select one of the previous for Rio to understand how the normaliser is to be applied within the platform.
Please note you can't create normalisers of the same type and scope with overlapping date ranges. Each transaction should only have either an account, or location scoped normaliser for a?specific timeframe.
Once you have created your normalisers you can then review and analyse your data using these comparative intensity factors within the range of dashboards located at the Reporting section of Rio by selecting the �Normalised� tab.
Please note that when you first open the Normalised dashboards no data will be presented until you select a Normaliser from the controls filter.