Background
The project tool and dashboard allows users to track planned consumption, cost and carbon savings of projects against real location-level data over time.
How to Enter the Project Report
Once you have followed the steps to add and edit projects, you can view the information associated with them in the Project Report.
Please note: Newly created projects take a day to refresh and pull through to the dashboard (This usually takes place daily at 12:15pm GMT)
From the Home Page, click �Reporting� on the left-hand menu:

Enter the �Project� report:
On entry, you will notice there are two tabs on the project dashboard. One for Efficiency Projects and another for Generation projects:
- Efficiency projects cover those where action has been taken to ensure resource efficiency (reducing energy or water consumption, reducing waste generation etc.)
- Generation projects are for all energy generation projects (such as solar or wind energy installations)

On entry, the project report will automatically filter for a scheme, as schemes link to categories which determine the utility type (kwh, m3, km, t etc.) . See support page � How to add, edit and delete projects� where the relationship between categories, schemes and projects are detailed.
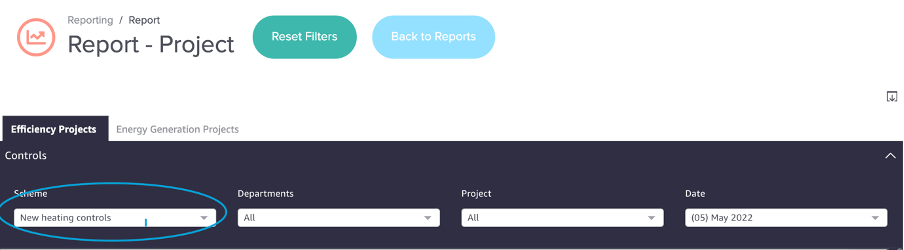
You can only view one scheme at a time, as the units associated with each scheme will differ (e.g. kWh for energy projects or tonnes for waste or material projects).
Examples of different types of schemes and their associated categories are below:
Once you have selected a scheme, the data in the tiles will update to aggregate data for all projects under the selected scheme.
To use the graphs below the tiles, a singular project must be selected from the �Project� filter (This is because when you create a project you select the reporting frequency and benefit of realisation period, which will differ from project to project, meaning their aggregated data makes the graph uninterpretable � see �How do I add, edit and delete projects?� support page for more info)
Switching between the �Efficiency Projects� and �Energy Generation Projects� tabs
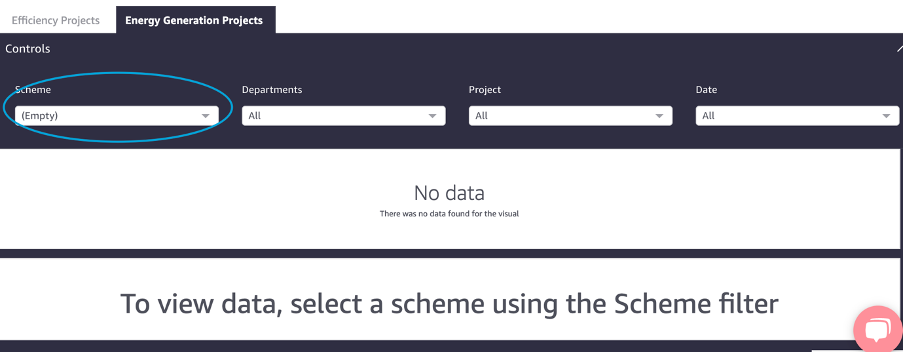
When you click into the �Energy Generation Projects� tab you must refresh the filters using the �Reset filter� button:
 You will then be prompted to select a scheme using the Scheme filter � this will refresh the filters to include schemes only applicable to Energy Generation Projects.