We understand your data may not always be available in the same format. Sourced from utility invoices, meter readings, or data exports provided by your facility partners, all this data can be hard to handle and consolidate into one place.
That's why your data can be uploaded to Rio in multiple ways, based on whichever format you receive it in. Any electricity data provided has to be associated with a specific electricity meter that is in turn associated to a location within your Rio account. To learn more about meters please take a look the following page: How do I create a meter?
Your account manager can help your organisation configure APIs to directly connect Rio to an Automatic Meter Reading system or database of utility data. Your organisation can also upload PDF files of invoices which are scanned by Rio, or you can upload excel exports of utility data provided by facilities managers or your finance team.
This support page will explain how to view, navigate, and access your organisation's data once it is uploaded into Rio.
If you need help uploading your data in all its various formats into Rio, you can find support on our page: "How do I upload data?"
You can view your organisation�s raw or visualised electricity data in Rio by navigating to two places in the platform's navigation menu:
Data and Reporting
What is Data in the navigation menu?
This area of Rio holds all data that has been uploaded to the platform and is organised by utility. To view data for a specific utility, select Data then the respective tile in the data table.
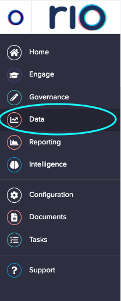
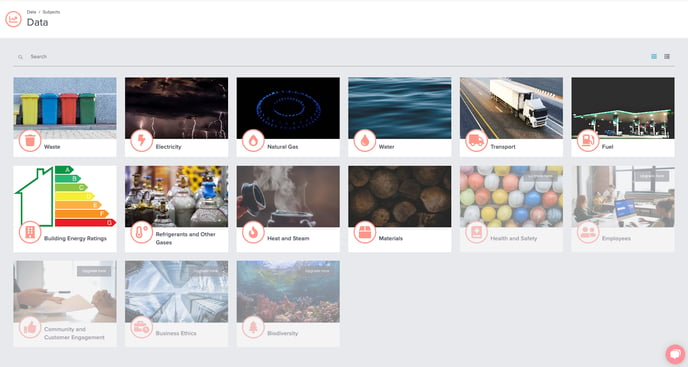
To navigate to all electricity data, for example, you can select the Electricity data tile.
This brings you to your electricity transactions table.
What is a transactions table?
The Transactions Table holds all individual records for the selected utility type. These records are referred to as transactions in Rio.
Transactions are organised by location and meter name. Each transaction will have a service period of that electricity consumption (Start Date/Time and End Date/Time) and the data type is indicated in the Act/Est column (All measured transactions from utility invoices, meter readings, and utility exports will be loaded as �ACT�. Any estimated transactions will be loaded as �EST�).
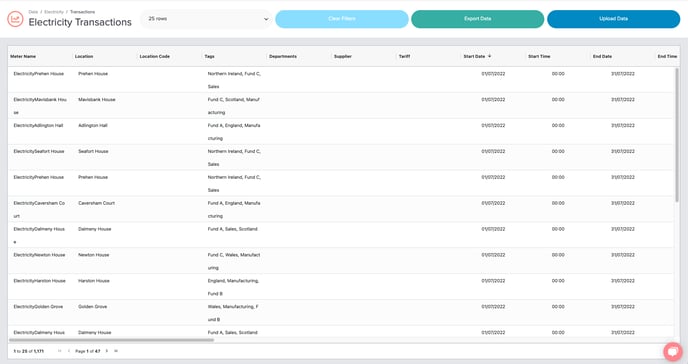
Each column header can be filtered to view all transactions for a desired location, meter, or selected time range. To filter any column, simply hover over the column heading until the filter menu appears, select the filter icon, and indicate your desired fields to filter.
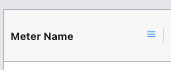
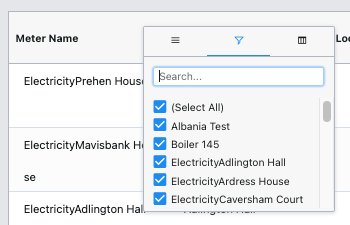
You can also export any data in the transactions table into an excel or CSV file. For support on how to export data from the transactions table, please see our page: "How do I export my data and information from Rio?"
Each transaction is linked to the supporting documentation that was originally uploaded into Rio and is accessible under the upload reference column.
You can view the original upload file by selecting the hyperlink in the upload reference column associated with each transaction and Rio will download the excel version of the original upload.
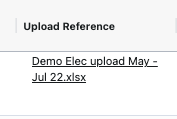
You can also navigate to a view of all files, their upload status, and uploader by selecting �upload data� at the top of the transactions table.
This will take you to a record of all uploads (including the upload file name, user responsible for uploading each file, timestamp, and any files that have been rolled back) as well as the option to upload data. For detailed upload instructions to help you get your data into Rio, you can find our data upload support under our page: "How do I Upload Data?"

How do I know which carbon conversion factors are being applied to my organisation�s electricity consumption?
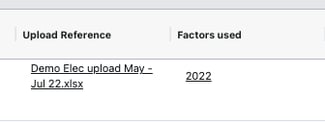
Carbon Conversion factors are also linked to each transaction in the carbon conversions factor column, found in the transactions table, clearly indicating the years of the factors applied to the kWh of consumption.
The year in this column is linked to Rio�s Carbon Conversion Factors table in Configuration which documents the kgCO2e per kWh used to calculate emissions. This level of granularity ensures your organisation�s data is auditable and transparent for any third-party verifications and disclosure standards.
My organisation uses renewable sources of electricity, how is this managed in Rio?
Renewable electricity from suppliers and onsite renewable generation (i.e. solar or wind) carbon emissions is accounted for by associating the appropriate Tariff. Tariffs are used to manage the type of electricity loaded into Rio and the associated carbon emissions for that electricity source.
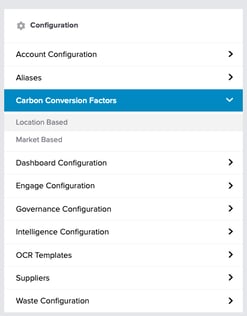
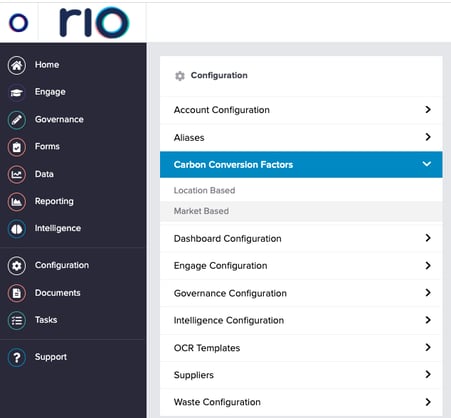
To view existing tariffs for your account, navigate to the market-based carbon conversions table in configuration. (Configuration>Carbon Conversion Factors>Market-Based)
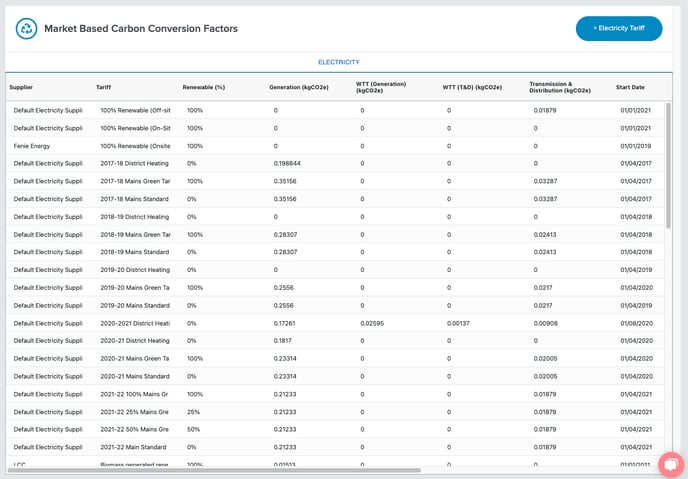
Whether your organisation has installed onsite solar panels or has sourced 100% renewable electricity from a specific supplier, you can add the kg CO2e/kWh by selecting �+ Electricity Tariff� at the top of the Market-Based Carbon Conversion Factors table.
See an example of renewable tariffs in the image below
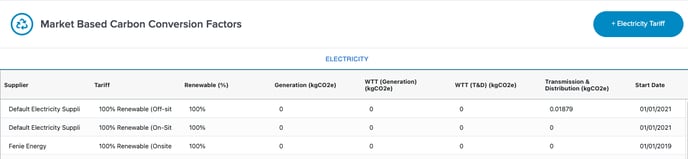
Any future transactions you load to a specific tariff will have those configured emissions factors. This can be done by populating the �Tariff� column when completing the Rio data upload template. If you leave this column blank, Rio will assume that data is to be loaded as the annual mains standard tariff (essentially, this is the location-based electricity factor for that site's location).
If you need any additional support, your account manager can help your organisation configure any bespoke tariffs.
Any supporting documentation, such as REGOs (Renewable Energy Guarantees of Origin) , Green Energy Attributes, or Evidence of REC (Renewable Electricity Certificate) Retirements can be saved in the Rio Documents section.
What is Reporting in the Navigation Menu?
All data loaded to the transactions tables flows into your organisation�s selected energy and emissions reports.
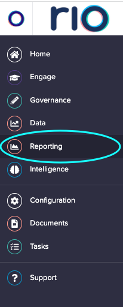
Rio offers dynamic carbon and electricity reporting, which your account manager can configure based on your organisation�s subscription and needs. These reports are accessible by selecting Reporting in the navigation bar.
The electricity report selected below visualises all consumption, cost, and emissions data from the electricity transactions table.
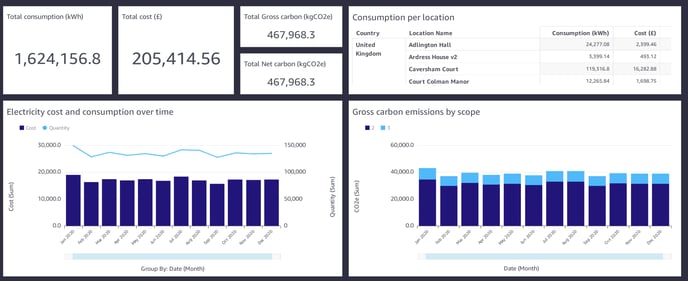
This report is live and will show your organisation�s emissions and consumption data in real time, based on the selected time period chosen in the reports filters.
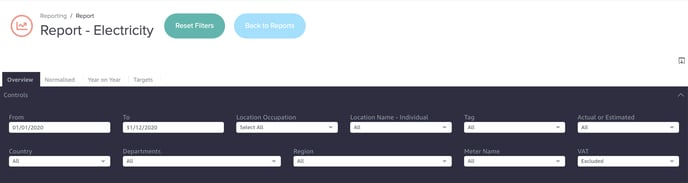
You can filter in the dashboards by selecting in the controls panel what type of data you would like to see. Rio offers the ability to view data for certain periods, countries, locations, meters, and data type (actual or estimated). You can also easily reset the filters by selecting reset filters at the top of the dashboard.
Can I sort and expand data tables in Rio�s Reports?
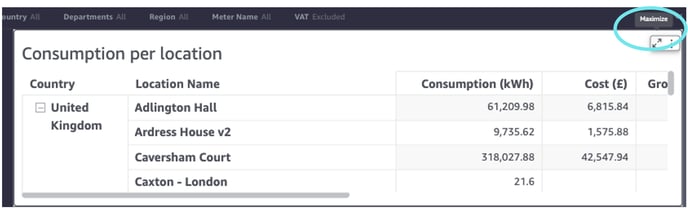
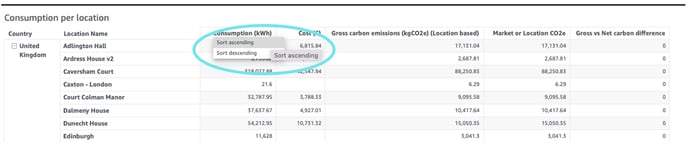
To sort or expand your data, hover over the top right corner of each table or graph until the icon appears to �maximise� the data set. To sort your data, you can also hover over the column header for any of the data columns in the tables.
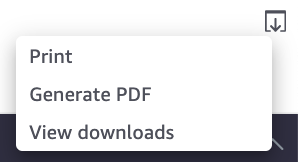
If you need to save a snapshot of your electricity report, this can be done by selecting the download icon in the top corner of the dashboard above the filters, which allows you to print or generate a PDF of the selected view.