
This support page will explain how to view, navigate, and manage your organisation�s transport data once it is uploaded into Rio.
We understand your data may not always be available in the same format. Sourced from locations, types of vehicles, or data exports provided by your facility partners, all this data can be hard to handle and consolidate into one place.
That's why your data can be uploaded to Rio in multiple ways, based on whichever format you receive it in. Any transport data provided has to be associated with a specific location which is created within your Rio account.
To learn more about locations please take a look the following page: How to add locations?
You can view your organisation�s raw or visualised transport data in Rio by navigating to two places in the platform's navigation menu:
Data and Reporting
What is Data in the navigation menu?
This area of Rio holds all data that has been uploaded to the platform and is organised by utility. To view data for a specific utility, select Data then the respective tile in the data table.
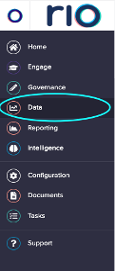
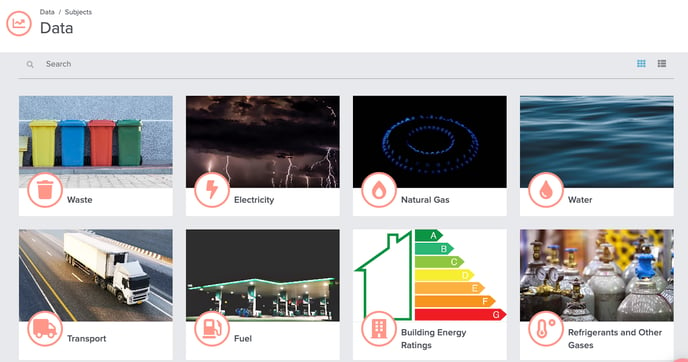
To navigate to all transport data, for example, you can select the Transport data tile. This brings you to your transport transactions table.
What is a transactions table?
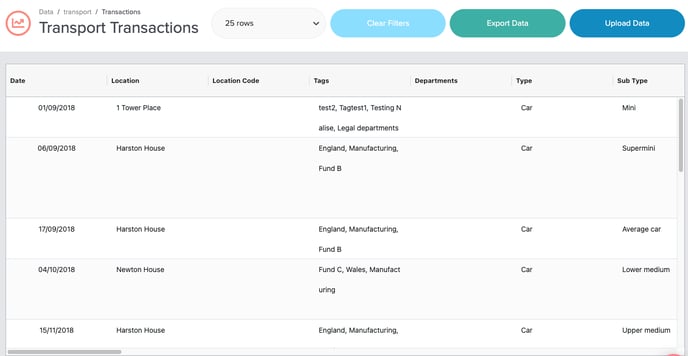
The Transactions Table holds all individual records for the selected utility type. These records are referred to as transactions in Rio. Transactions are organised by location for transport data. Each transaction will have a date when the journey occurred, the kind of vehicle which was used for the transportation and other details such as destination, distance travelled and purpose of the travel/journey.
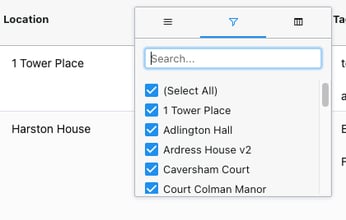
Each column header can be filtered to view all transactions for a desired location, or selected date range. To filter any column, simply hover over the column heading until the filter menu appears, select the filter icon, and indicate your desired fields to filter.
You can also export any data in the transactions table into an excel or CSV file. For support on how to export data from the transactions table, please see our page: "How do I export my data and information from Rio?"
Each transaction is linked to the supporting documentation that was originally uploaded into Rio and is accessible under the upload reference column.
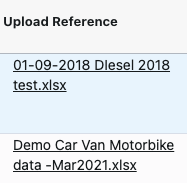
You can view the original upload file by selecting the hyperlink in the upload reference column associated with each transaction and Rio will download the excel version of the original upload.
You can also navigate to a view of all files, their upload status, and uploader by selecting �upload data� at the top of the transactions table.
This will take you to a record of all uploads (including the upload file name, user responsible for uploading each file, timestamp, and any files that have been rolled back) as well as the option to upload data. For detailed upload instructions to help you get your data into Rio, you can find our data upload support under our page: "How do I Upload Data?"

What is Reporting in the Navigation Menu?
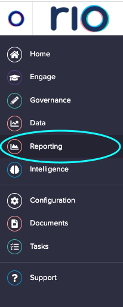
All data loaded to the transactions tables flows into your organisation�s selected energy and emissions reports.
Rio offers dynamic transport reporting, which your account manager can configure based on your organisation�s subscription and needs. These reports are accessible by selecting Reporting in the navigation bar.
The transport report selected below visualises distance travelled, fuel consumption, cost, and emissions data from the transport transactions table.
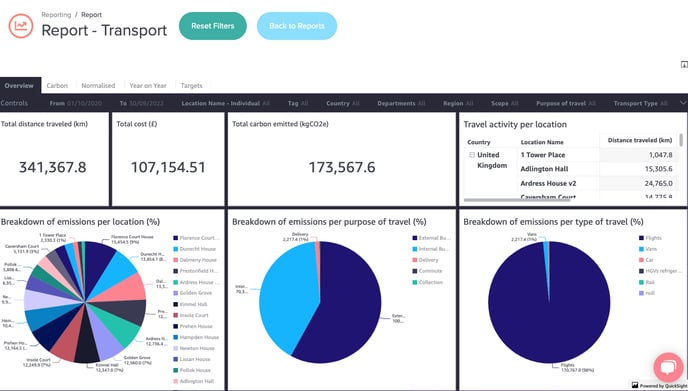
This report is live and will show all transport transactions in real time, based on the selected period or other controls chosen in the reports filters.
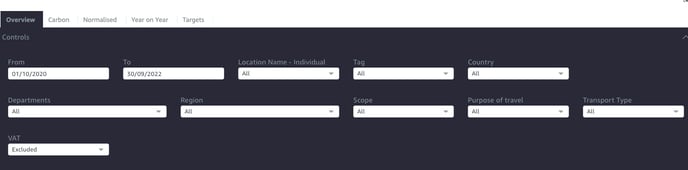
You can filter in the dashboards by selecting in the controls panel what type of data you would like to see. Rio offers the ability to view data for certain periods, countries, locations, purpose of travel and transport type. You can also easily reset the filters by selecting reset filters at the top of the dashboard.
Can I sort and expand data tables in Rio�s Reports?
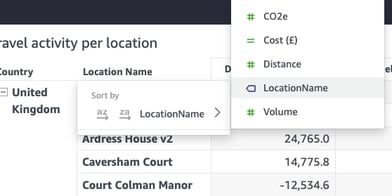
To sort or expand your data, hover over the top right corner of each table or graph until the icon appears to �maximise� the data set. To sort your data, you can also hover over the column header for any of the data columns in the tables.
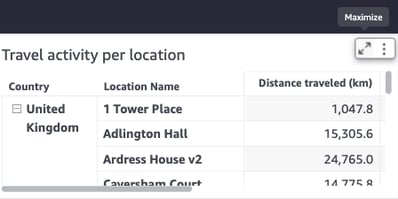
You can even filter out based on location, cost, emissions, and quantity for instance.
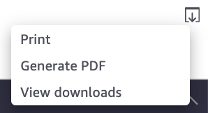
If you need to save a snapshot of your transport report, this can be done by selecting the download icon in the top corner of the dashboard above the filters, which allows you to print or generate a PDF of the selected view.
How do I know which carbon conversion factors are being applied to my organisation�s transportation transactions?
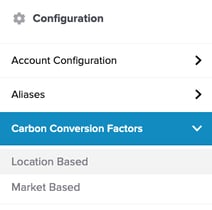
Carbon conversion factors which are applied to each transport transaction are based on the UK Government conversion factors for company reporting of greenhouse gas emissions (DEFRA).
Rio automatically applies these carbon conversion factors to each transportation transaction, based on the reporting year, type, and sub type of travel . Rio Users can navigate to these carbon conversion factors under configuration to view a specific factor by selecting the transportation type, sub-type, and unit.
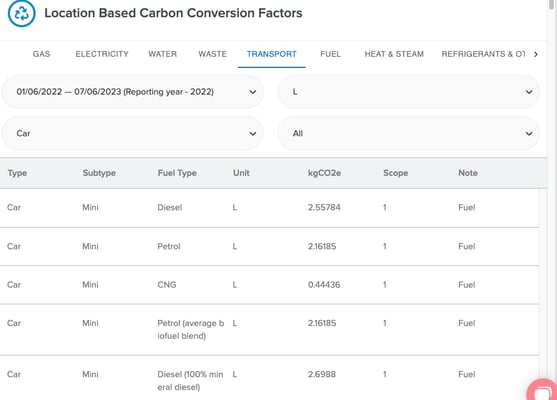
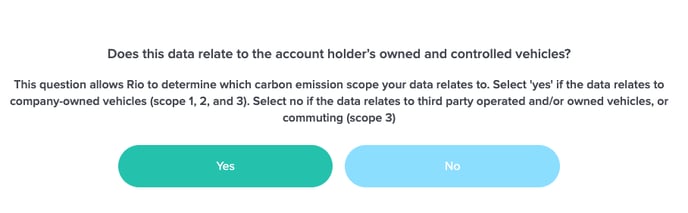
Dependent on if those vehicles/planes are owned or leased by the reporting organisation, the emissions will fall under either Scope 1 or 3.
This ownership data is collected upon upload, where a user is prompted to indicate the scope before submitting data into the Rio platform.
Flights data and 'radiative forcing'
- Without RF
- With RF
- Unknown