
What is the Utilities tab?
The Utilities tab, located in the Carbon Report, allows users to view all activity data uploaded for each location in a consolidated report.
This dashboard can allow users to:
- View at the location-level trends in activity data over a specified time
- View all transactions apportioned across each month they serve
- For example, this can be quite useful if a location has an electricity invoice from 01/01/2022-31/12/2022, which was uploaded as a single row of data in Rio's transactions table. The utilities tab will show this apportioned across the selected reporting period.
- View the proportion of actual vs estimated data points for the selected period
- This can be further broken down by unit if a specified emission source is selected. For example when a user filters for electricity Rio will show the estimated kWh vs actual kWh for the specified time period
- View for gaps or anomalies in reported location-level data
Locating the Utilities Tab
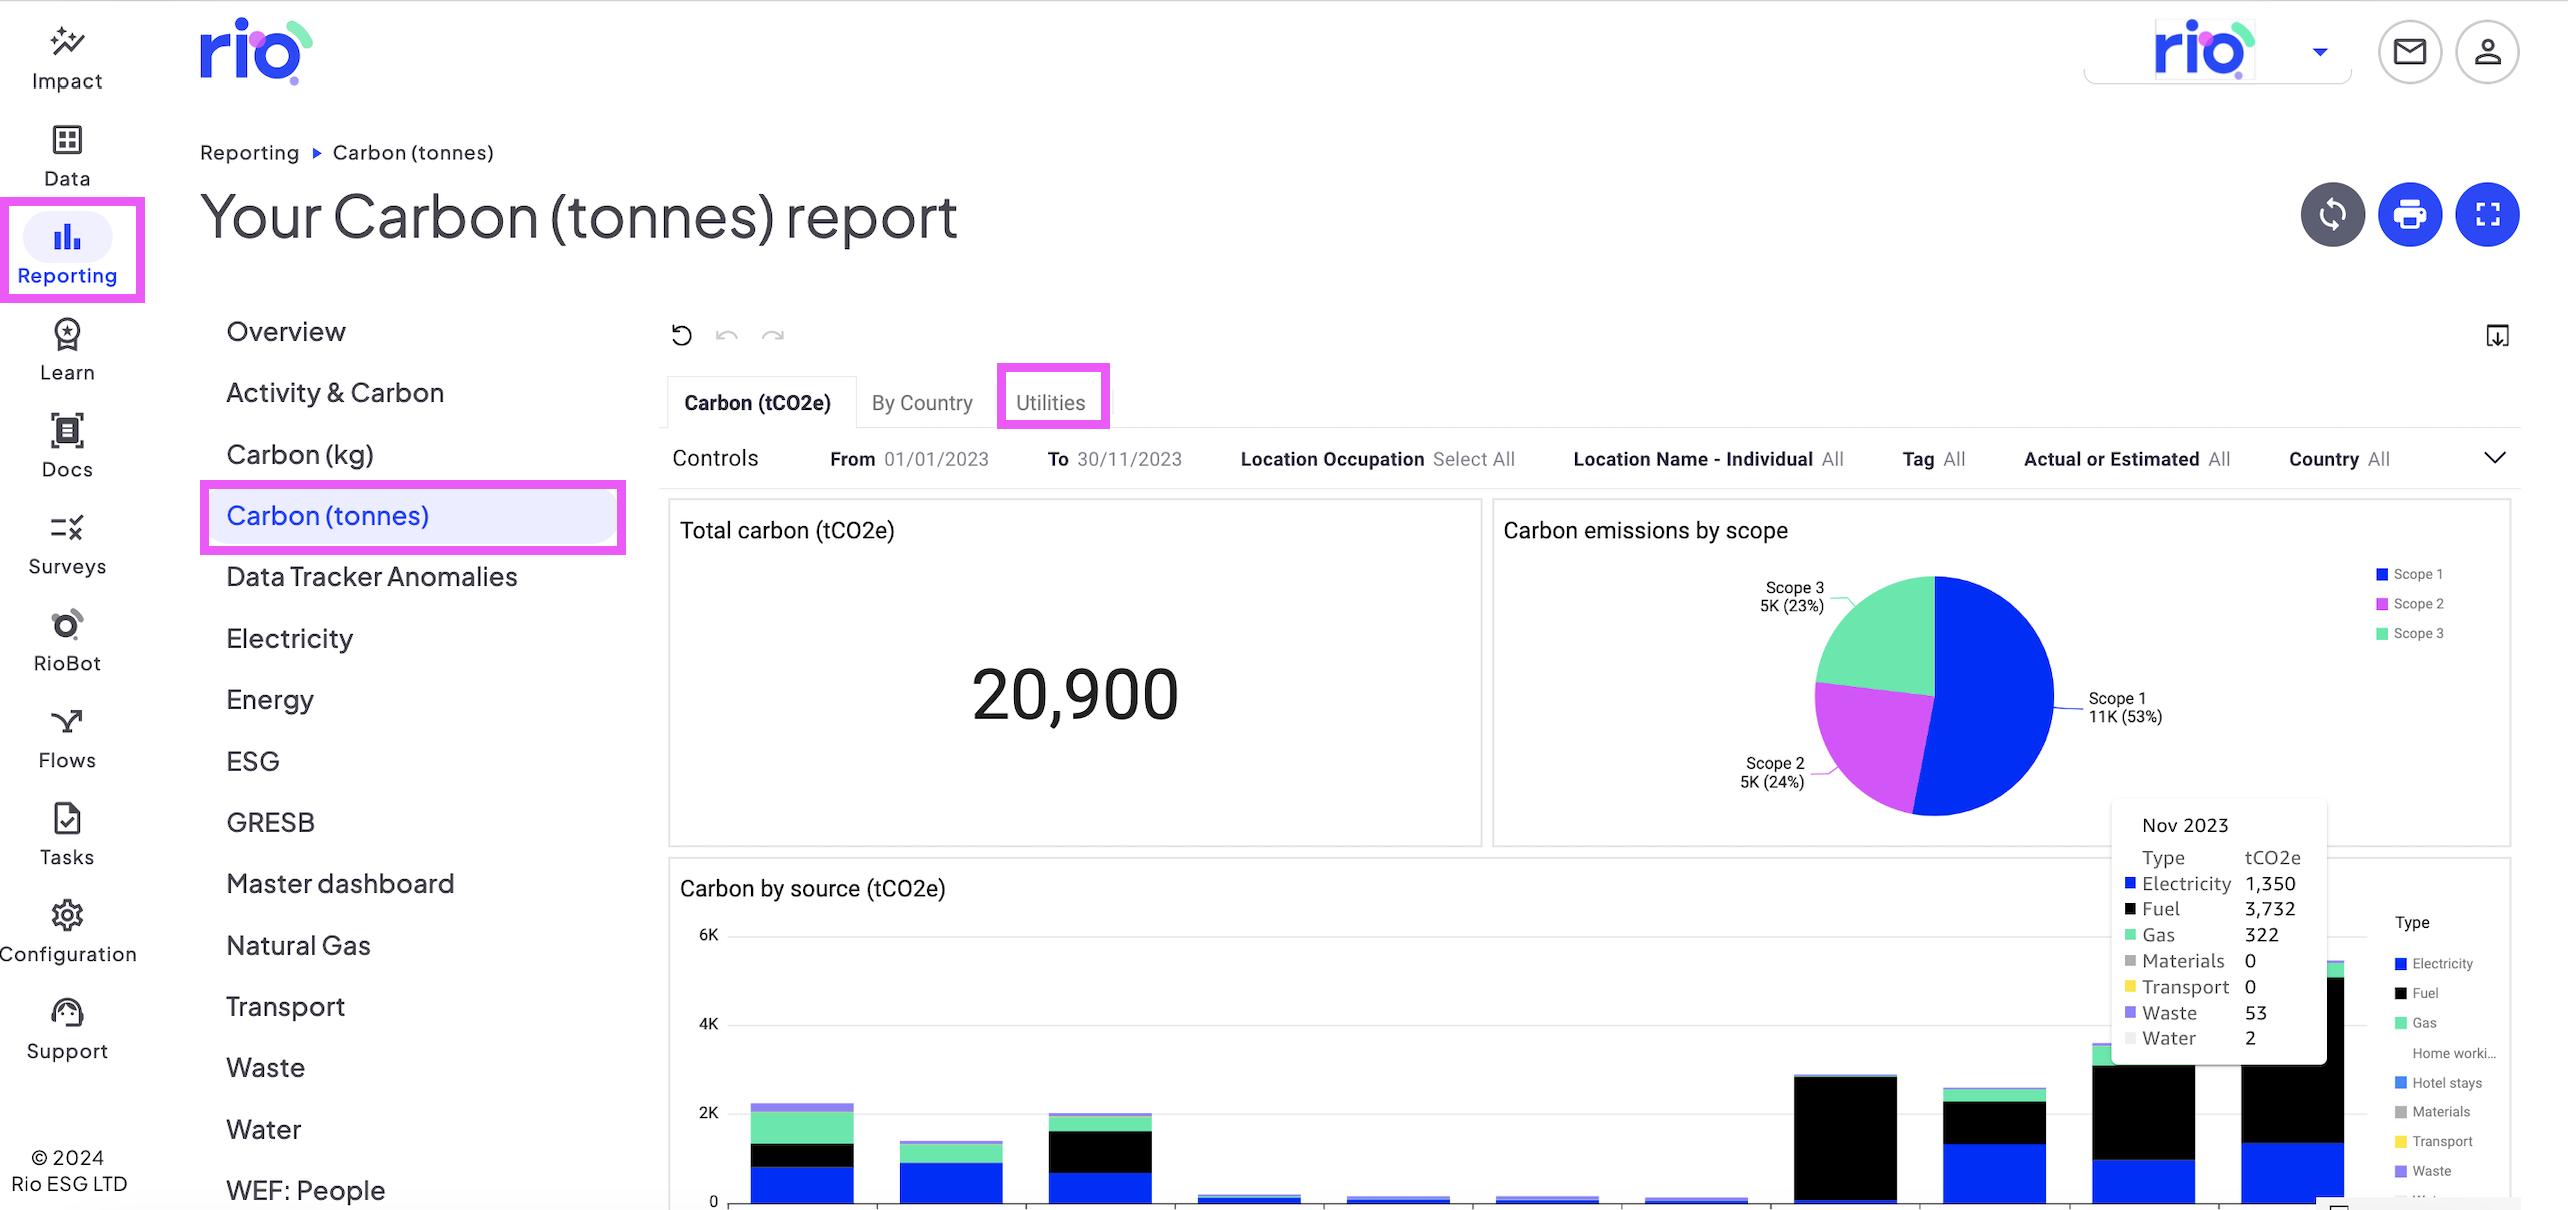
To access the utilities tab navigate to Reporting>Carbon (kg or tonnes)>utilities indicated in the tab at the top of the Carbon Report.
Interrogating data in the Utilities Tab
Users can utilise the filters to view specific time periods, emission sources, locations, or data type (actual vs estimated).
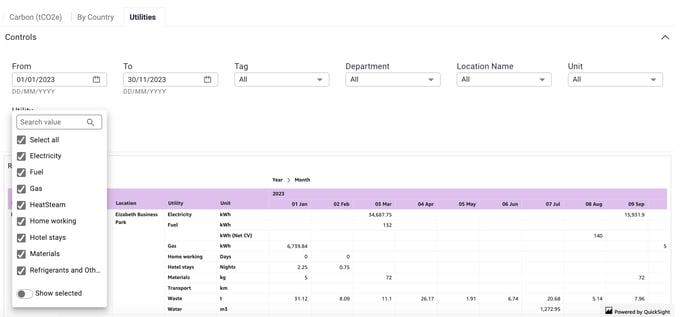
Once the desired filters have been applied, users can interact with each tile, minimising/maximising their view, and exporting into csv or excel if required.
To export data, hover over the right corner of each tile, select the three dots and select "Export to CSV" or "Export to Excel" as appropriate.

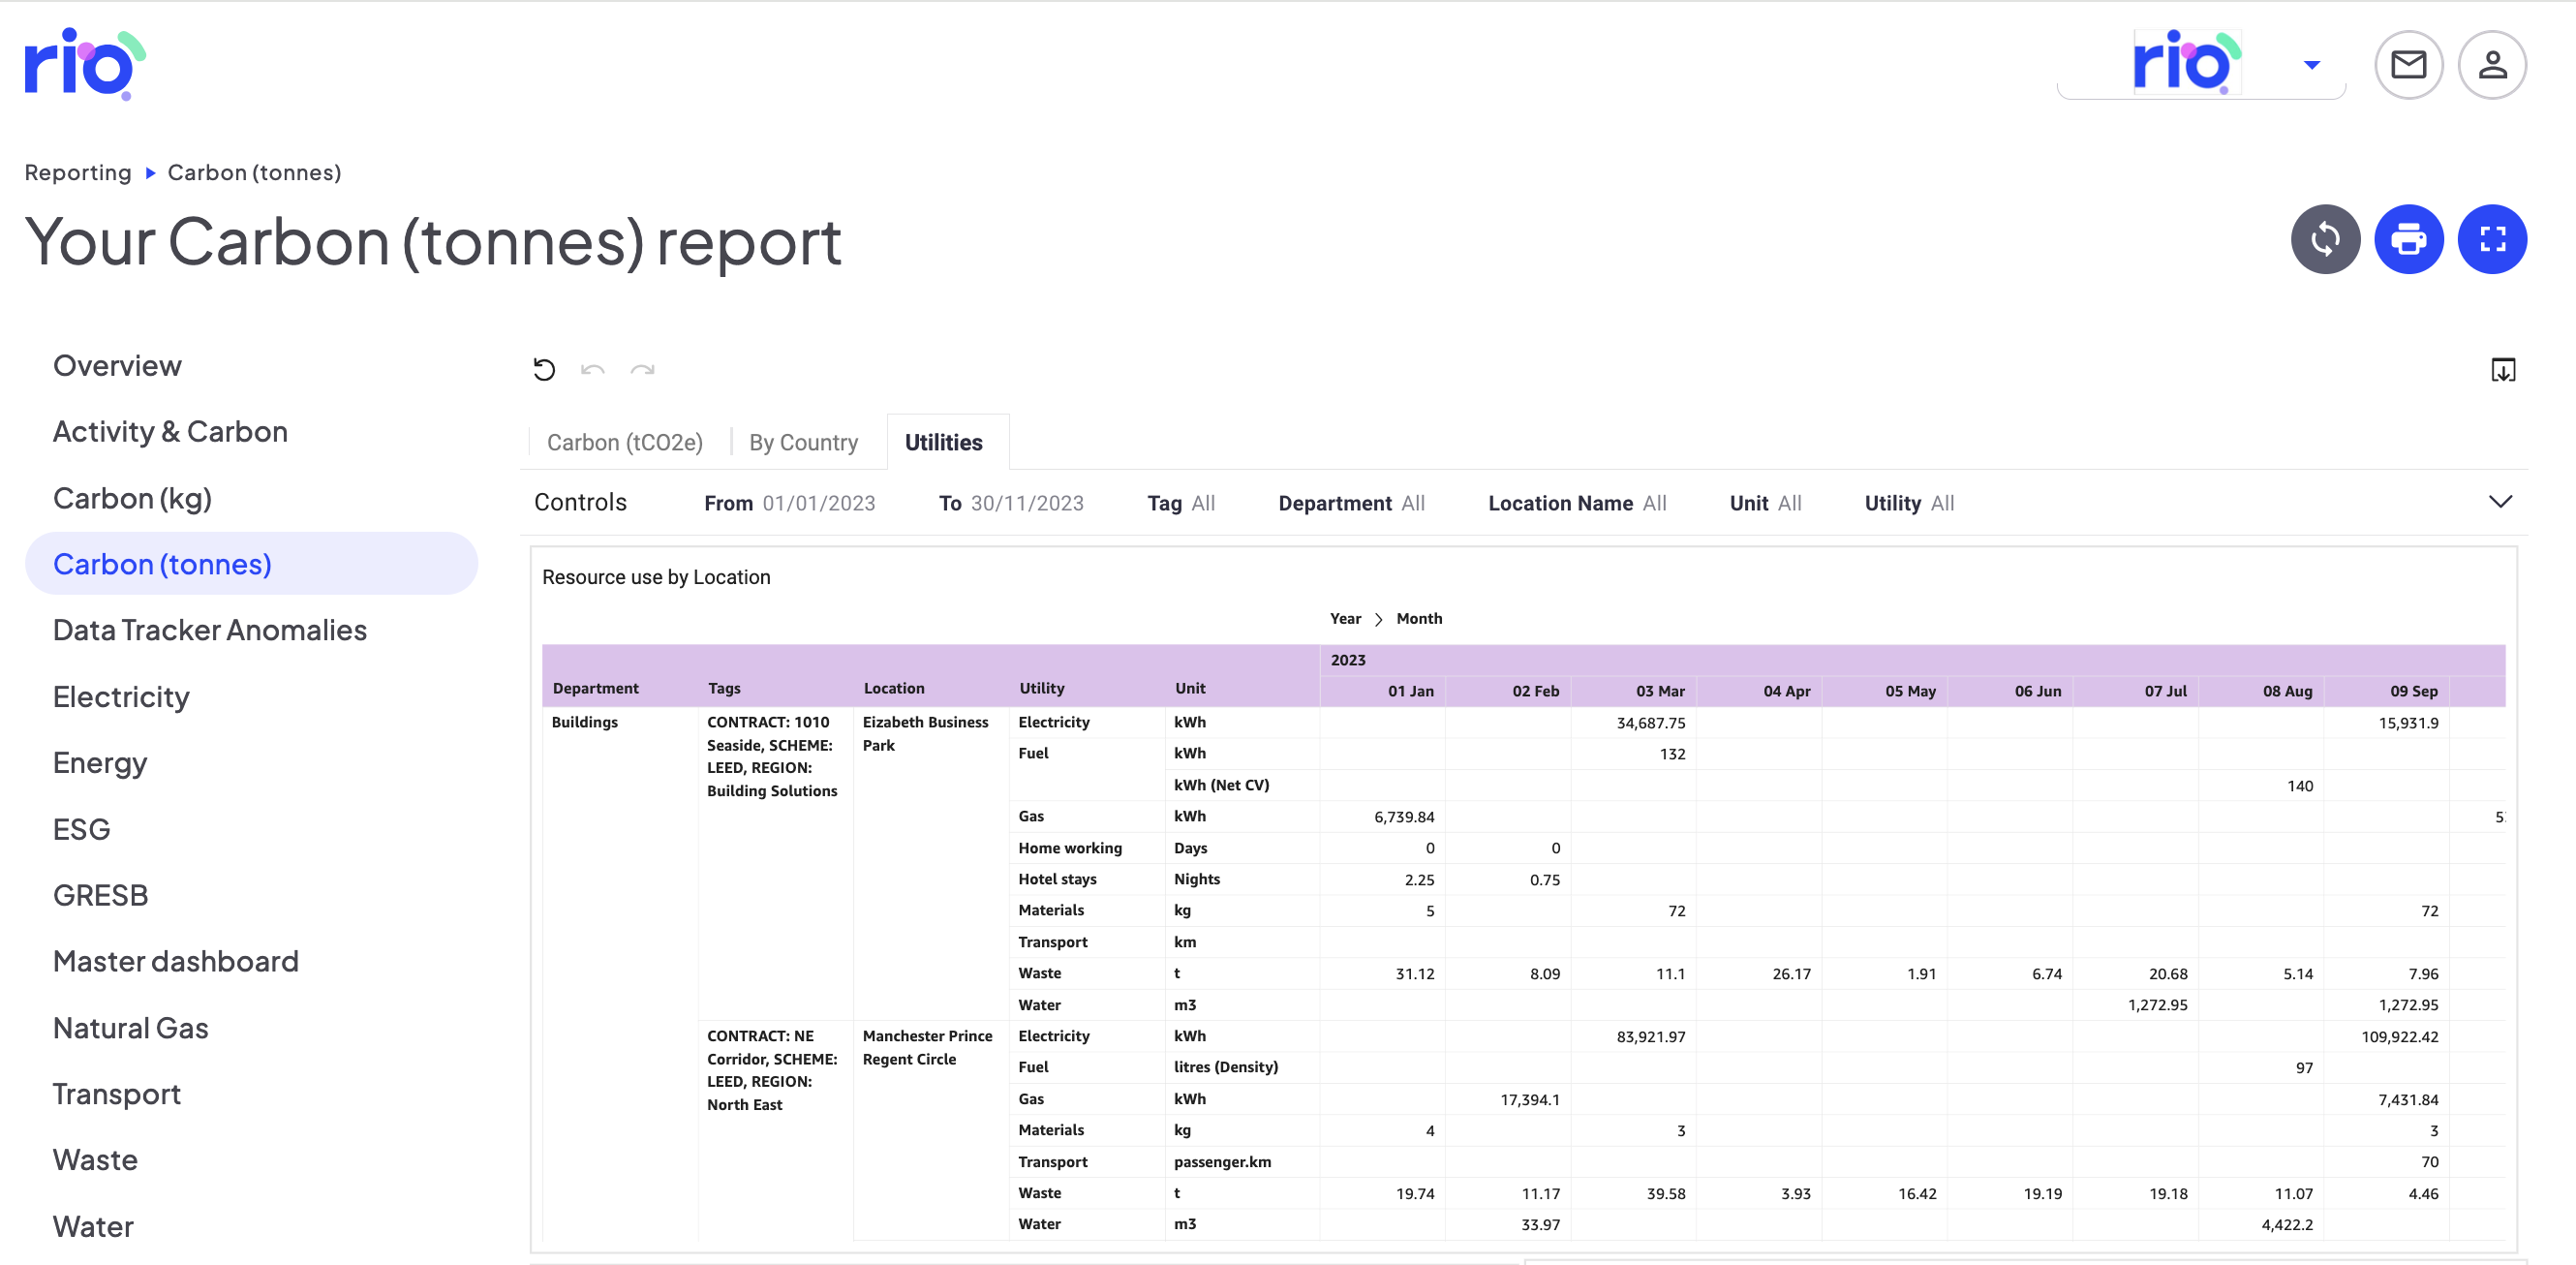
To view Location-level data:
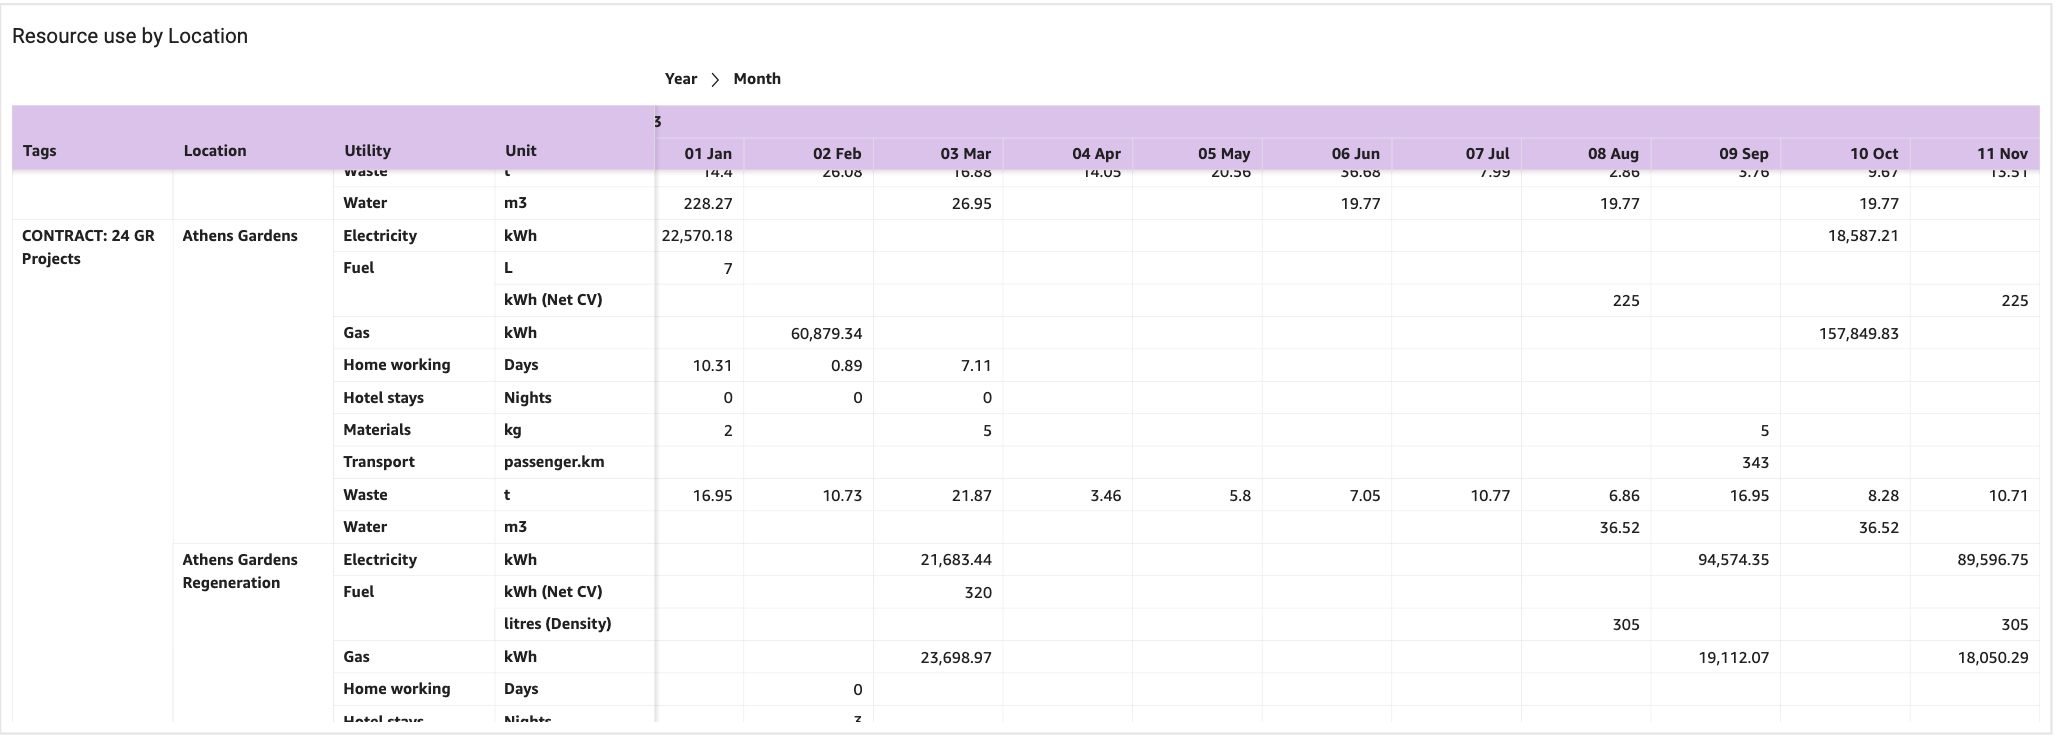
- Utilise the "Resource use by Location" table
To view proportion of estimated vs actual transactions
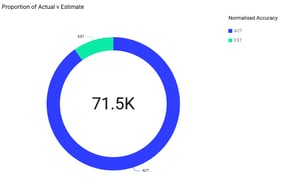
- Utilise the "Proportion of Actual v Estimate" chart
- In this example, Rio is displaying the rows of data indicated as either actual or estimated transactions
To view proportion of estimated vs actual data weighted by unit:
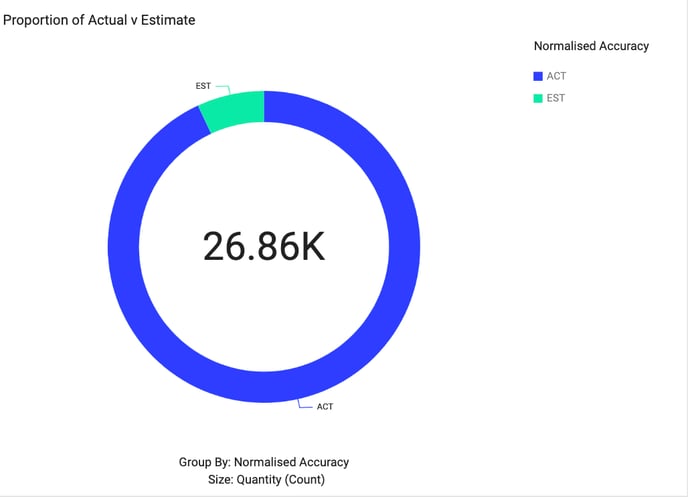
- Utilise the "Proportion of Actual v Estimate" chart
- Filter for a desired utility in the filters, and Rio will update this chart accordingly.
- In this example, the user has filtered for "electricity " and Rio is displaying the total kWh and the % of estimated vs actual kWh
To view a detailed report of daily apportioned data by utility, location, and meter:
- Utilise the "Breakdown including Meter name and Accuracy" table. This will provide users with a view on:
- Location
- Utility Type
- Meter (For gas, electricity, water, heat and steam)
- Unit of activity data (L for fuels, kWh for electricity data etc.)
- Quantity
- Accuracy (actual vs estimated)
- CO2e
- Date (daily apportioned rate)
- This table is recommended for users who wish to see raw activity and emissions data in a format which can easily be viewed in pivot tables and further excel analysis and interrogation as required.