
A normaliser is a value that you can create in Rio that allows you to make relative comparisons of your organisation's performance.
Normaliser are static values bound by a date range and are typically specific to a company�s business and their key performance indicators (KPIs). They are used to report on intensity-based metrics.
For more on how to configure a normaliser in Rio, this article provides information on �How to create a normalisers�
Data and in particular, carbon footprint data or �GHG emissions�, can be reported in absolute and intensity-based terms.
To explain how this works we will use GHG emissions as an example:
- Absolute emissions/data = total emissions (no calculation applied apart from summing all quantities) This is the total you would see in your carbon dashboard
- Intensity emissions/data = total emissions divided by a relevant unit so that you get emissions per unit. Examples include emissions per person; emissions per unit of output; or emissions per dollar generated etc.
Intensity based reporting is useful because it can control for growth or change over time e.g. if a business grows you want to be able to compare emissions before and after growth. It would not necessarily be fair to only compare total emissions before and after growth - instead you may wish to compare emissions per employee to determine whether, as the number of employees have increased, emissions per employee have also increased over time.
Below is an example of how you might look at how emissions need to reduce at a national level over time, considering growth in terms of GDP and carbon emissions.
In Rio, it is used as a divider in some dashboards' visuals. For example an organisation that has 500 employees consumed 10 000 kWh of electricity within a date range. In this case we can create an account scope normaliser of employee number type with a value 500. The normalised energy value will be 10000 kWh / 500 = 20 kWh per employee.
Dashboards
To use a normaliser on the dashboards you have to apply correct filtering.
To do this you would first select a normaliser (alternatively you could select the desired scope and then select a normaliser). The normaliser dropdown will show a list of normalisers related to the scope and in the normaliser name there will be date range displayed. This relates to the start and end date for which the normaliser is valid for and is dynamically updated when a user updates values in configuration.

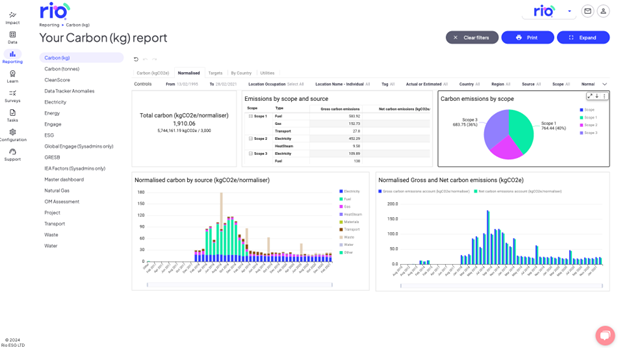
Set correct transactions date range interval. The dashboard will then calculate the values as follows:
- It will read the normaliser�s relevant date range set in configuration (as shown in the name of the normaliser).
- It will find the total quantity for the relevant data type for the date range the normaliser is relevant for.
- It will find the value for the normaliser as set in configuration for the relevant date range.
- It will divide the total quantity in step 2 by the value of the normaliser specified in configuration in step 3.
When applying date range filter on dashboard, the normaliser dropdown filter will not be updated with only the correct relevant values. Meaning that if you pick 2018, you still will be able to see non-relevant 2015 or 2021 normalisers. Make sure that you pick the correct date range filter and a normaliser with the correct date range interval.
Rio will only use the total quantity between the date range specified in configuration. Rio does, however, allow a user to select a smaller date range within the date range configured in configuration in case a user would like to apply the normaliser to a smaller total quantity.
E.g. if a user wanted to look at quarterly performance they could set a normaliser for a year and then apply the normaliser to a quarter�s worth of data within the defined date range of the normaliser.
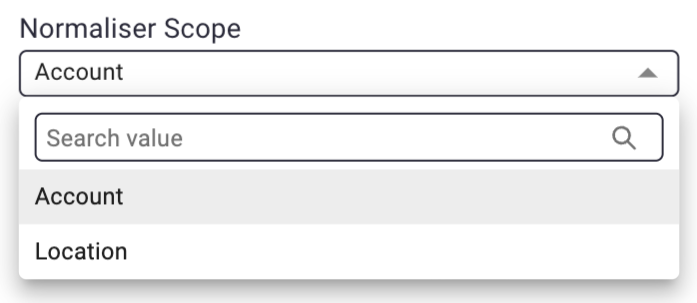
You can select the scope of a normaliser by clicking on the drown down menu and selecting location/account:
Here is an example for account level normalisers:
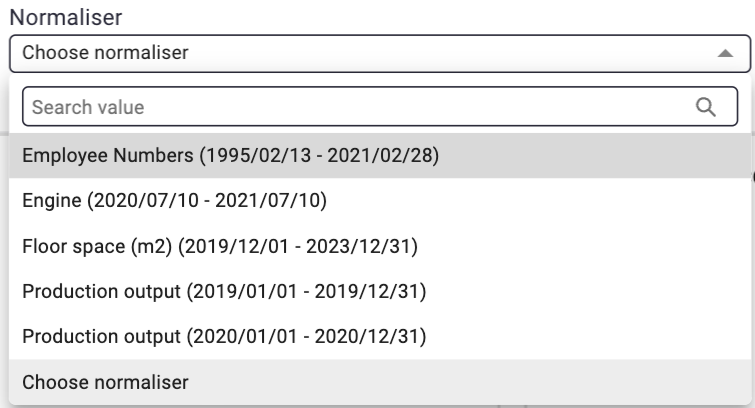
It is still possible to filter by locations to change quantities to which the normaliser is applied to. However the normaliser value will not change (as this has been set in configuration). The exception is of course for normalisers which have been applied at the location level. You can always see locations to which normaliser is applied in the Locations dropdown.
In this case, 2499.32 kWh is total consumption, 100 - normaliser Quantity.
24.99 - resulting normalised value.
NOTE: If you select a date range which does not overlap with the date range defined for a normaliser in configuration you will see �No data� error messages.